Supervised Study on Heart Disease

Introduction
Heart disease is a leading cause of death worldwide. Due to the potential for heart disease to cause negative effects, such as death, it may be important to investigate ways to prevent heart disease.
One way to prevent heart disease is to examine the risk factors for heart disease. Understanding risk factors may help prevent heart disease development because, for example, it may allow medical practitioners to identify individuals who are susceptible to developing heart disease. After identification, early preventative interventions could be applied to this high-risk group, reducing the likelihood of heart disease.
Research Questions and Hypotheses
Therefore, the aim of the current investigation is to investigate the factors that contribute to the development of heart disease. More specifically, we investigate the three following questions:
- What lifestyle variables are related to the diagnosis of heart disease?
- What variables are most important to the diagnosis of heart disease?
- What groups of people are most likely to develop heart disease?
To investigate the first two questions, we will conduct logistic regression analysis. To investigate the third question, we will use decision trees.
We hypothesize that, based on previous research (Ryo, Cho & Kim, 2012), that a number of variables (e.g. body mass index, smoking habits) will be related to heart disease. Furthermore, we will investigate the questions of identifying importance of coefficients, and identification of high risk groups for heart disease in an exploratory manner.
Methods and Dataset
To investigate our research questions, we obtain a dataset on Kaggle about heart disease (Pytlak, 2022), a subset of data collected by the Center for Disease Control and Prevention (CDC) in 2022. The CDC conducted telephone interviews for 401,958 residents of the United States across all 50 states. Participants were interviewed about a number of (that is, 279) general lifestyle factors (e.g. smoking habits) and chronic health diseases.
The dataset on Kaggle (Pytlak, 2022) was filtered to contain only variables related to heart disease, resulting in 18 heart-disease related factors, and cleaned (e.g. missing values were removed), resulting in 319,795 responses with no missing values. Amongst the dataset of 319,795 responses we obtained on Kaggle, 18,078 duplicate responses were found and removed, resulting in a final sample size of 301,717 observations.
Table 1 provides a full description of variables in the dataset, including the questionnaire presented to interviewees, response type, observed distribution. In total, the dataset contains 17 lifestyle predictor factors (4 numeric, 13 categorical) to investigate on self-reported heart disease. Prior to data analysis, a number of variables were recoded (race turned into a binary variable, age category reduced into a four-group ordinal categorical variable) due to feedback received during exploratory data analysis.
| Variable Name | Questionnaire | Data Type | Observed distribution |
|---|---|---|---|
| HeartDisease | Have you ever had coronary heart disease or myocardial infection in your life? | Binary (yes, no) | Imbalanced binary (9% yes, 91% no) |
| BMI | What is your body mass index? | Continuous | Normal (mean = 28.3, variance = 40) |
| Smoking | Have you smoked at least 100 cigarettes in your entire life? | Binary (Yes, no) | Binary (59% no, 41% yes) |
| AlcoholDrinking | Do you drink heavily? (Men: more than 14 drinks a week, women: more than 7 drinks a week) | Binary (Yes, no) | Imbalanced binary (7% yes, 93% no) |
| Stroke | Have you ever had a stroke? | Binary (Yes, no) | Imbalanced binary (4% yes, 96% no) |
| PhysicalHealth | Thinking about your physical health, which includes physical illness and injury, for how many days during the past 30 days was your physical health not good? | Discrete (0-30 days) | Poisson (lambda = 3.3) |
| MentalHealth | Thinking about your mental health, for how many days during the past 30 days was your mental health not good? | Discrete (0-30 days) | Poisson (lambda = 3.9) |
| DiffWalking | Do you have serious difficulty walking or climbing stairs? | Binary (Yes, no) | Imbalanced binary (14% yes, 86% no) |
| Sex | Are you male or female? | Binary (Yes, no) | Binary (48% Male, 52% Female) |
| AgeCategory | What is your age group? | Ordinal categorical (e.g. less than 40, 40-59, 60-79, greater than 80) | Normal |
| Race | What is your race? (recoded to binary variable) | Binary (White, non-white) | Imbalanced binary (77% white, 23% non-white) |
| Diabetic | Have you ever had diabetes? | Nominal categorical (No, borderline diabetes, yes, yes (during pregnancy)) | Positive skew (86% no, 14% non-no) |
| PhysicalActivity | Have you had physical activity or exercise during the past 30 days other than their regular job | Binary (Yes, no) | Imbalanced binary (78% yes, 22% no) |
| GenHealth | Would you say your health in general is | Ordinal categorical (Poor, fair, good, very good) | Negative skew (poor 4%, fair 10%) |
| SleepTime | On average, how many hours of sleep do you get in a 24-hour period? | Continuous | Normal (mean = 7, variance = 2) |
| Asthma | Have you ever had asthma? | Binary (Yes, no) | Imbalanced binary (14% yes, 86% no) |
| KidneyDisease | Have you ever had kidney disease (not including kidney stones, bladder infections)? | Binary (Yes, no) | Imbalanced binary (4% yes, 96% no) |
| SkinCancer | Have you ever had skin cancer? | Binary (Yes, no) | Imbalanced binary (9% yes, 91% no |
Table 1: Variables in the Dataset
Logistic Regression Analysis
Logistic regression is a statistical method used to analyze and model relationships between a binary dependent variable (i.e., one that takes on only two values, such as 0 or 1) and one or more independent variables (also known as predictors or explanatory variables). It is a type of regression analysis that is used to predict the probability of an event occurring based on the values of the independent variables.
Model Fitting
Interaction term shows that one’s effect on response variable depends on the other, with only one of the variable might not have predictive power, but combine them together, we can predict. Based on our EDA, we add interaction terms of AgeCategory, Sex, AgeCategory, and Race as our full model.
Goodness of Fit Tests
In logistic regression, we can perform an overall goodness-of-fit test using the likelihood ratio test, which compares the full model to a reduced model without the predictors of interest. The test is based on the difference in deviances between the full model and the reduced model, and it follows a chi-squared distribution with degrees of freedom equal to the difference in the number of parameters between the two models.
The null hypothesis of the likelihood ratio test is that the reduced model fits the data as well as the full model. And the alternative hypothesis is that the full model fits the data significantly better than the reduced model.
According to the goodness of fit test, we choose the model with terms.
Variable Selection
To get a simpler model, we decided to perform the backward elimination stepwise selection based on the AIC. Stepwise selection is a statistical method to identify the best subset of predictors in a regression model. Backward elimination will remove the predictor one by one based on their contribution. PhysicalHealth, MentalHealth, and PhysicalActivity are removed from the process.
Model Diagnosis
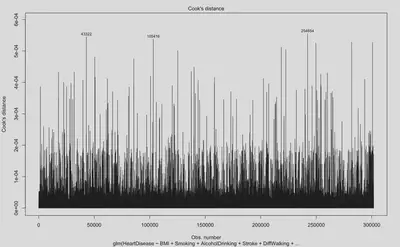
Cook’s distance is a measure of the influence of each observation on the fitted values of a regression model. A large Cook’s distance indicates that the corresponding observation has a significant impact on the regression results. As shown by Figure 1, there were a large number of influential points during model fit. Digging into what observations are considered highly influential, we found that these observations generally have response values that are outliers compared to the mean (e.g. BMI values of 40, when BMI is a normally distributed variable with mean of 28 and standard deviation of 6).
Research Questions 1
- Question 1: What lifestyle variables are related to heart disease?
According the final model we select in logistic regression analysis, except PhysicalHealth, MentalHealth, and PhysicalActivity, all the other variables are associated with heart disease.
Research Questions 2
- Question 2: What variables are most important to the development of heart disease?
In the logistic regression model, the estimated coefficients represent the change in the log-odds of the outcome associated with a one-unit increase in the predictor variable, holding other variables constant. Variables with larger coefficients (absolute value) are generally considered more important. But we should combine the p-value of them to see if the association is real or by chance (big p-value).
According to the summary of the stepwise model, AgeCategory80 or older, GenHealthPoor, AgeCategory60-79, and GenHealthFair are the most important variables indicators for heart disease (please refer to the coefficients and p-values in the following Table 2.)
| Variable | Coefficient | p-value |
|---|---|---|
| AgeCategory 80 or older | 2.104838900 | < 2e-16 |
| GenHealth Poor | 1.924924675 | < 2e-16 |
| AgeCategory 60-79 | 1.499782865 | < 2e-16 |
| GenHealth Fair | 1.499782865 | < 2e-16 |
Table 2: Important Variables in the Logistic Regression Model
Decision Tree Analysis
To examine what groups of people are most likely to develop heart disease, we ran a decision tree classifier model. We chose to run this model because decision trees provide easy and practical boundaries, allowing us to identify groups of patients that are most likely to develop heart disease.
Model Fitting
To examine high risk groups using decision trees, we followed these broad steps. First, we found the optimal decision tree for the dataset using 10-fold cross validation (cutting the tree at the optimal node size resulting from this process). Second, based off this tree, we distinguish between groups that have high risk of heart disease, and we filter the dataset to specifically examine group features that are at risk of developing heart disease. We repeat steps 1 and 2 until we find that the probability of a group having heart disease is above 50%. In total, the decision tree analysis process was repeated two times, described below.
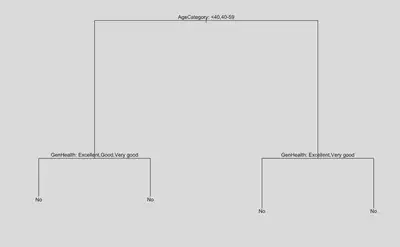
In the first step of the process, 10 fold cross validation revealed that the optimal tree size was with 5 nodes (Figure 2.1) for the entire dataset. Plotting this tree (Figure 2.2), we can see from the results of the decision tree that if you are under 59 years of age and in good overall health, then the decision tree predicts the absence of heart disease (that is, you are in a low risk group). Furthermore, according to Figure 2.2, other factors such as mental health, race, physical activity, have little impact on the development of heart disease
In contrast, those who are older than 59 and report having health that is worse than good are at a higher risk of developing heart disease. If we examine this subset specifically, we select a total sample of 26,945 (8.93% of the total sample). These people are at a higher risk of getting heart disease, where the probability of having heart disease increases from 9.03% (whole dataset) to 31.30% (high risk group).

In the second step of the process, we repeat fitting of the decision tree model to the high risk group. Plotting the optimal tree (Figure 2.3; node size determined by cross validation), we identify another important feature of stroke history. In the high risk group, if there was no prior history of stroke, the decision tree predicts that the absence of a heart attack. In contrast, in the high risk group, if there was prior history of stroke, the risk of having heart disease increases from 31.10% to 50.67%.
Research Question 3
- Question 3 What groups of people are most likely to develop heart disease?
Based on the result of the decision tree analysis, Table 3 shows how our observations are categorized into different risk groups. People who are over the age of 60, have poor or fair health, and have past history of stroke were most likely to develop heart disease (50.67% of being diagnosed with heart disease).
| Group | Condition | Probability of Having Heart Disease |
|---|---|---|
| Whole population benchmark | None | 9.03% |
| Low risk group | Age below 59 or having health condition above good | 6.85% |
| High risk group | Age above 60 or having health condition below good | 31.10% |
| Extremely risk group | In high risk group and had stroke history | 50.67% |
Table 3: Identifying High Risk Groups for Development of Heart Disease
Conclusion
The present investigation aimed to develop a better understanding of risk factors that contribute to heart disease by asking three broad questions. First, we investigated what variables are related to the development of heart disease. Our final logistic regression model found the 15 variables of BMI, Smoking, AlcoholDrinking, Stroke, DiffWalking, Sex, AgeCategory, Race, Diabetic, GenHealth, SleepTime, Asthma, KidneyDisease, SkinCancer to be associated with the development of heart disease.
Second, we investigated what variables are most important to the development of heart disease. According to the rank of our final logistic regression model, AgeCategory80 or older, GenHealthPoor, AgeCategory60-79, and GenHealthFair, were the most important predictors of heart disease, with coefficients of above 1.5 (controlling for other variables).
Third, we investigated what groups were most at risk of developing heart disease. Our final decision tree model distinguished between different groups at risk for heart disease, from low risk groups (e.g. 6.85% of heart disease) to high risk groups (e.g. 50.67% of heart disease), and identified the high risk group as people over the age of 45, in poor or fair general health, with past history of stroke.
Taken together, the findings from the current investigation identified, in a large-scale and representative sample of residents in the United States, risk factors that may contribute to the development of heart disease, findings of which may have implications for the real world, such as informing medical practitioners.
Limitations and Future Directions
While the present investigation yielded several insights into the risk factors related to heart disease, it should be noted that there were also a number of limitations.
One limitation is that, although our investigation yielded a large number of significant risk factors linked to heart disease, the factors within this investigation is only able to explain a weak proportion of the variation in heart disease, with an adjusted R-squared of 0.2 (though see Ryo et al., 2012 for similar R-squared values). In other words, though risk factors were identified, these risk factors may be less relevant because they may not be the main driving factors behind heart disease onset.
Why may there be a low R-squared value? There may be a variety of reasons. For one, it is possible that the methods of the current investigation may contribute to a low R-squared value. For example, it is possible that that the current investigation fails to capture important predictor variables (e.g. biological or genetic markers) that are relevant to heart disease onset, to explain for the low variation explained in heart disease. Furthermore, it is also possible that the subjective nature of the methodology (e.g. telephone survey, self-reported heart disease, retrospective self-reports of exercise history) may hinder the extent to which explanatory variables can be related to response variables, compared to more objective measures of heart disease (e.g. biological measurements of heart disease). Future work could improve upon methodology (e.g., obtaining objective measurements of heart disease) when investigating risk factors for heart disease.
Second, it is also possible that the current modelling techniques may be the result of low R-squared values. For example, diagnostic plots during the fitting of logistic regression models showed that there were a high number of influential points (e.g. potentially due to a large number of imbalanced binary predictors), of which violates one of the assumptions of logistic regression models (that is, lack of influential points) and contributing to poor fit. Furthermore, another factor that may account for poor model fit of logistic regression models is imbalanced response variables. In the future, alternative modelling techniques should be considered, such as using models (e.g. generalized additive models) and methods (e.g. oversampling; Ustyannie & Suprapto, 2020) that are less susceptible to imbalanced predictors and response variables.
References
Pytlak, K. (2022, February 16). Personal key indicators of heart disease. Kaggle. Retrieved March 24, 2023, from https://www.kaggle.com/datasets/kamilpytlak/personal-key-indicators-of-heart-disease
Ryoo, J.-H., Cho, S. H., & Kim, S.-W. (2012). Prediction of risk factors for coronary heart disease using Framingham risk score in Korean men. PLoS ONE, 7(9). https://doi.org/10.1371/journal.pone.0045030
Ustyannie, W., & Suprapto, S. (2020). Oversampling method to handling imbalanced datasets problem in binary logistic regression algorithm. IJCCS (Indonesian Journal of Computing and Cybernetics Systems), 14(1), 1. https://doi.org/10.22146/ijccs.37415